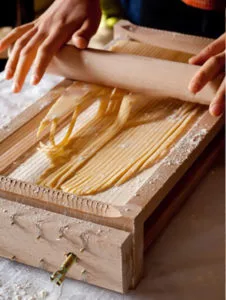
It’s National Pasta Day! A recent poll on today.yougov.com shared some stats on the US and our pasta habits.
Here are a few more stats on our pasta-eating habits . . .
- What’s your favorite pasta shape? Spaghetti is #1 with 33% of the vote. Then it’s penne, 12%, macaroni, 11%, and tortellini, 7%.
- What’s the best pasta shape specifically for mac-and-cheese? Macaroni got the most votes. But 12% of people prefer shells, 7% prefer corkscrews , 6% said bowtie pasta, 5% like penne, and 5% think rotini is best.
- What’s your favorite sauce? 52% said spaghetti sauce, 44% said alfredo, 4% said pesto is their #1.
- 93% of Americans always have at least one box or bag of pasta in the house.
- 21% of us use a fork and spoon to eat spaghetti. Using the spoon for twirling the pasta onto your fork.
- 50% of us break our pasta in half, mostly because it’s easier to fit in the pot. 38% don’t, and 4% said it varies, while 8% said they never make spaghetti.
- Only 3% of us never eat pasta. 75% have it at least once a week.
- 75% of us eat it at least once a week, including 5% who said every day.
It looks like you are not a member of VIP Club yet. Please fill out the form below to access the page and join the VIP Club


